
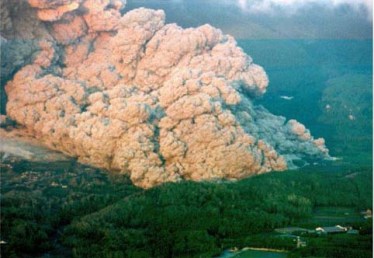
Figure .1 Mount Pinatubo 1991
Before the eruption in the early 90’s, Pinatubo was a rather unassuming mountain on the island of Luzon, Philippines. Standing only 2000 ft above surrounding peaks, it was almost obscured from vision. It’s flanks covered in lush green forest, without an eruption in memorable history, people never saw it as a threat. This change in June 1991 when it produced the second largest eruption of the 20th century (after Novarupta 1912).

Figure 2. Damage from the earthquake in 1990.
In 1990, on July 16th a magnitude 7.8 rocked the island of Luzon. A strike-slip along the Philippine Fault System it caused a surface rupture oer 125 km long. Killing over a thousand people it became the deadliest earthquake in Philippine history but may also have been the start of something much greater, geologists have long been convinced that it is linked to Pinatubo’s activity the following year. However it has never been proven if this earthquake stirred the sleeping volcano or if the reawakening caused the quake. For a few weeks after locals reported steam coming from Pinatubo, but when it was visited by PHILVOLC’s scientists there was only landslide evidence and not emissions.
Seismicity kicked off activity again on March 15th 1991. The north-west side of the volcano felt a swarm of tremors increasing in intensity over the next two weeks. On April 2nd a 1.5 km fissure opened along the summit with phreatic explosions dusting the local area in ash. seismicity continued to increase causing volcanologist to rush to its flanks to place monitoring equipment they had never thought to place while the mountain lay in slumber. The volcanoes eruptive history had very been studied before and they were surprise to learn it had large eruptions as recent as roughly 500, 3500 and 5500 years ago. On April 7th the first formal evacuations took place. With the Clark Air base just 14 km from Pinatubo the USGS aided PHILVOLCS in setting up 3 zones the first, a 10 km radius from the summit was the initial area to be designated unsafe and people were quickly evacuated to safety. Further zones from 10-20 km and 20-40 km were deemed safe for now but people were told to be alert to the possibility of evacuation if the mountain showed any sign of getting worse.

Figure 3.
Activity stepped up in May with sulfur dioxide emissions rocketing from roughly 500 t p/d at the beginning of the month to over 5000 t p/d by May 28th. At this point emission slightly decreased and inflation began to increase rapidly leading many to believe pressure was building with the magma chamber.
On June 3rd the first lava was noticed signalling that a magmatic phase of the eruption had begun which eased some people’s mind as activity seemed relatively effusive. The first large explosion cam four days later on June 7th. An eruption column towered 7 km above the summit prompting the second wave of evacuations with people in the 10-20 km zone being prompted to leave their homes. A lava dome began to grow dramatically in the next few days reaching in excess of 600 ft wide. Activity seemed pretty constant at a low-level until 03:41 on June 12th when a new, more violent phase of eruptions began. As explosions intensified over the next few hours the eruption column grew to over 19 km. Pyroclastic flows surged as 4km from the summit in some valleys. Ash and tephra rained down on the surrounding area as the intense explosions lasted over . The final wave of evacuations was called for on the morning of June 13th as a small but intense earthquake swarm saw in a third phase in the eruption.

Figure 4. On of the most iconic images from the 1991 eruption.
People as far as 40 km away, and even further if possible, were urged to leave the area as quickly and calmly as possibly as Pinatubo showed no signs of slowly down its activity. The column peaked again, this time over 24 km high. Several more large explosions were recorded for the next 24 hours including one at lunch time on the 14th with saw another 21 km eruption column and more pyroclastic flows obscuring the view of the flanks.
From midday on June 15th the eruption reached its most climatic point. By 2.30 pm on the June 15th readings stopped being received from seismometers and other remote censoring equipment which the USGS had placed at Clark Air base indicating the area had been over some by the pyroclastic material still being ejected at a terrifying rate. An ash cloud covered an area greater than 125,000 km2 bringing near total darkness to much of the island of Luzon and ashfall was recorded as far as neighbouring countries of Cambodia, Malaysia and Vietnam. By 10.30pm that night all fell quiet and Pinatubo’s fury seemed to be over.

Figure 5. Mapping the spread of the SO2 released by Pinatubo.
The VEI 6 eruption spat out over 10,000,000,000 tonnes of material and a whopping 17,000,000 tonnes of sulphur dioxide. It was the later which signed Pinatubo’s fate in people’s minds as the SO2 emitted quickly covered the globe causing the mean global temperatures to drop by 0.5°C for the following two years. Sulphur dioxide in the atmosphere reflects the Sun’s radiation back in to space meaning the Earth’s surface received up to 10% less sunlight in the following year. It also meant an increase in ozone damage, with the hole above the Antarctic being at the largest it had ever been.
An estimated 847 people lost their lives (many from collapsing buildings under the weight of the ashfall),but problems continued past initial fatalities in the aftermath. Over 2.1 million people have believed to have been affected by the disaster. Agriculture was severely effected both my ash fall and then following effects of the climate. Lahars plagued the region for years after with each heavy rain fall. It is often put by the end of 1992 the eruption and resulting lahars caused the country losses in excess of 400 million US dollars.
Despite this, the events of 1991 are often hailed a volcanological triumph with quick responses, prediction and evacuation believed to have saved the lives of thousands. It enabled us to gain an insight to volcanic impacts on climate and how we monitor the risks.
Figure 1. http://www.slate.com/articles/life/welltraveled/features/2012/tempting_fate_in_the_philippines_/dennis_rodman_s_dad_and_the_eruption_of_mount_pinatubo_.html
Figure 2. http://xuwenewegu.webatu.com/earthquake-in-philippines-july-25-2011.php
Figure 3. http://www.coolgeography.co.uk/GCSE/AQA/Restless%20Earth/Volcanoes/Mount%20Pinatubo.htm
Figure 4. https://www.uclm.es/profesorado/egcardenas/pa.htm
Figure 5. http://earthobservatory.nasa.gov/IOTD/view.php?id=1510


 The days of virgin girls meeting a fiery death may be long gone and now mainly goats and chickens lose there lives, but it is still shows the connections and respect people have for our planet and its power. This festival is not the only one world-wide which has a similar theme and I feel no matter the scientific findings about the inner working of our planet it will never deter such worship.


 The threat of another eruption to the scale of 1792 brought journalists and scientists alike flocking to the surrounding area to monitor the activity of Unzen and its potential threat. Sadly this curiosity resulted in the deaths of 43 when on June 3rd activity peaked due to a possible lava dome collapse. This sent a huge pyroclastic flow surging down its flanks and funnelled in to a valley point in the direction where volcanologists and journalists had set up a base at what was thought to be a safe distance, over 4.5 km, from the summit.
 Activity continued well in to 1995 and over 10,000 pyroclastic flows were recorded over this period. By the end of the eruption a new lava dome was in place 1.2 by 8 km wide. Its volume was approximated at 0.1 cubic km. In total, about 0.21 cubic km of plagioclase-phyric dacite magma was erupted over the course of the eruption at peak effusive rates of 7 cubic metres per second in 1991. Over 2000 buildings were destroyed by these flows in Shimabara City alone. Matters were further complicated between August 1992 and July 1993 when heavy rains caused multiple lahars destroying a further 1300 homes along the Mizunashi and Nakao Rivers, requiring the sudden evacuation of several thousand residents.
 Harry was an American volcanologist who although was based at USGS was funded by outside organisations. He specialised in volcanic debris flows and was closely involved with research on St Helens with his doctoral thesis ‘Rockslide-debris Avalanche of May 18, 1980, Mount St. Helens Volcano, Washington‘ being recognised as a leading paper on the event.
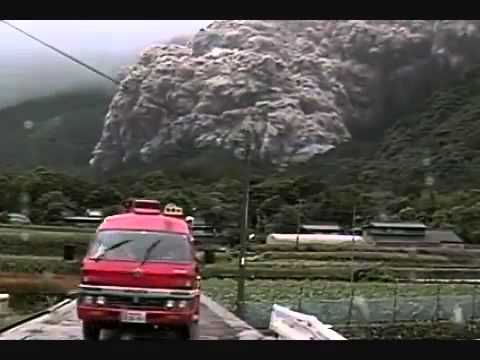

 Head of the National Disaster Mitigation Agency (BNPB) Willem Rampangilei has instructed Karo Regent to take quick measures to vacate the red zones (Gamber village, Simpang Empat district and Karo Regency) but they know that this is easier said then done. The pyroclastic flows caused by partial collapses of the growing lava dome occurred in a series at 14:28, 15:08 and 16:39 local time on Saturday. Rescue attempts went through the night and in to Sunday morning. An ash column remained for hours, towering over the area darkening the skys and hampering the search operation.

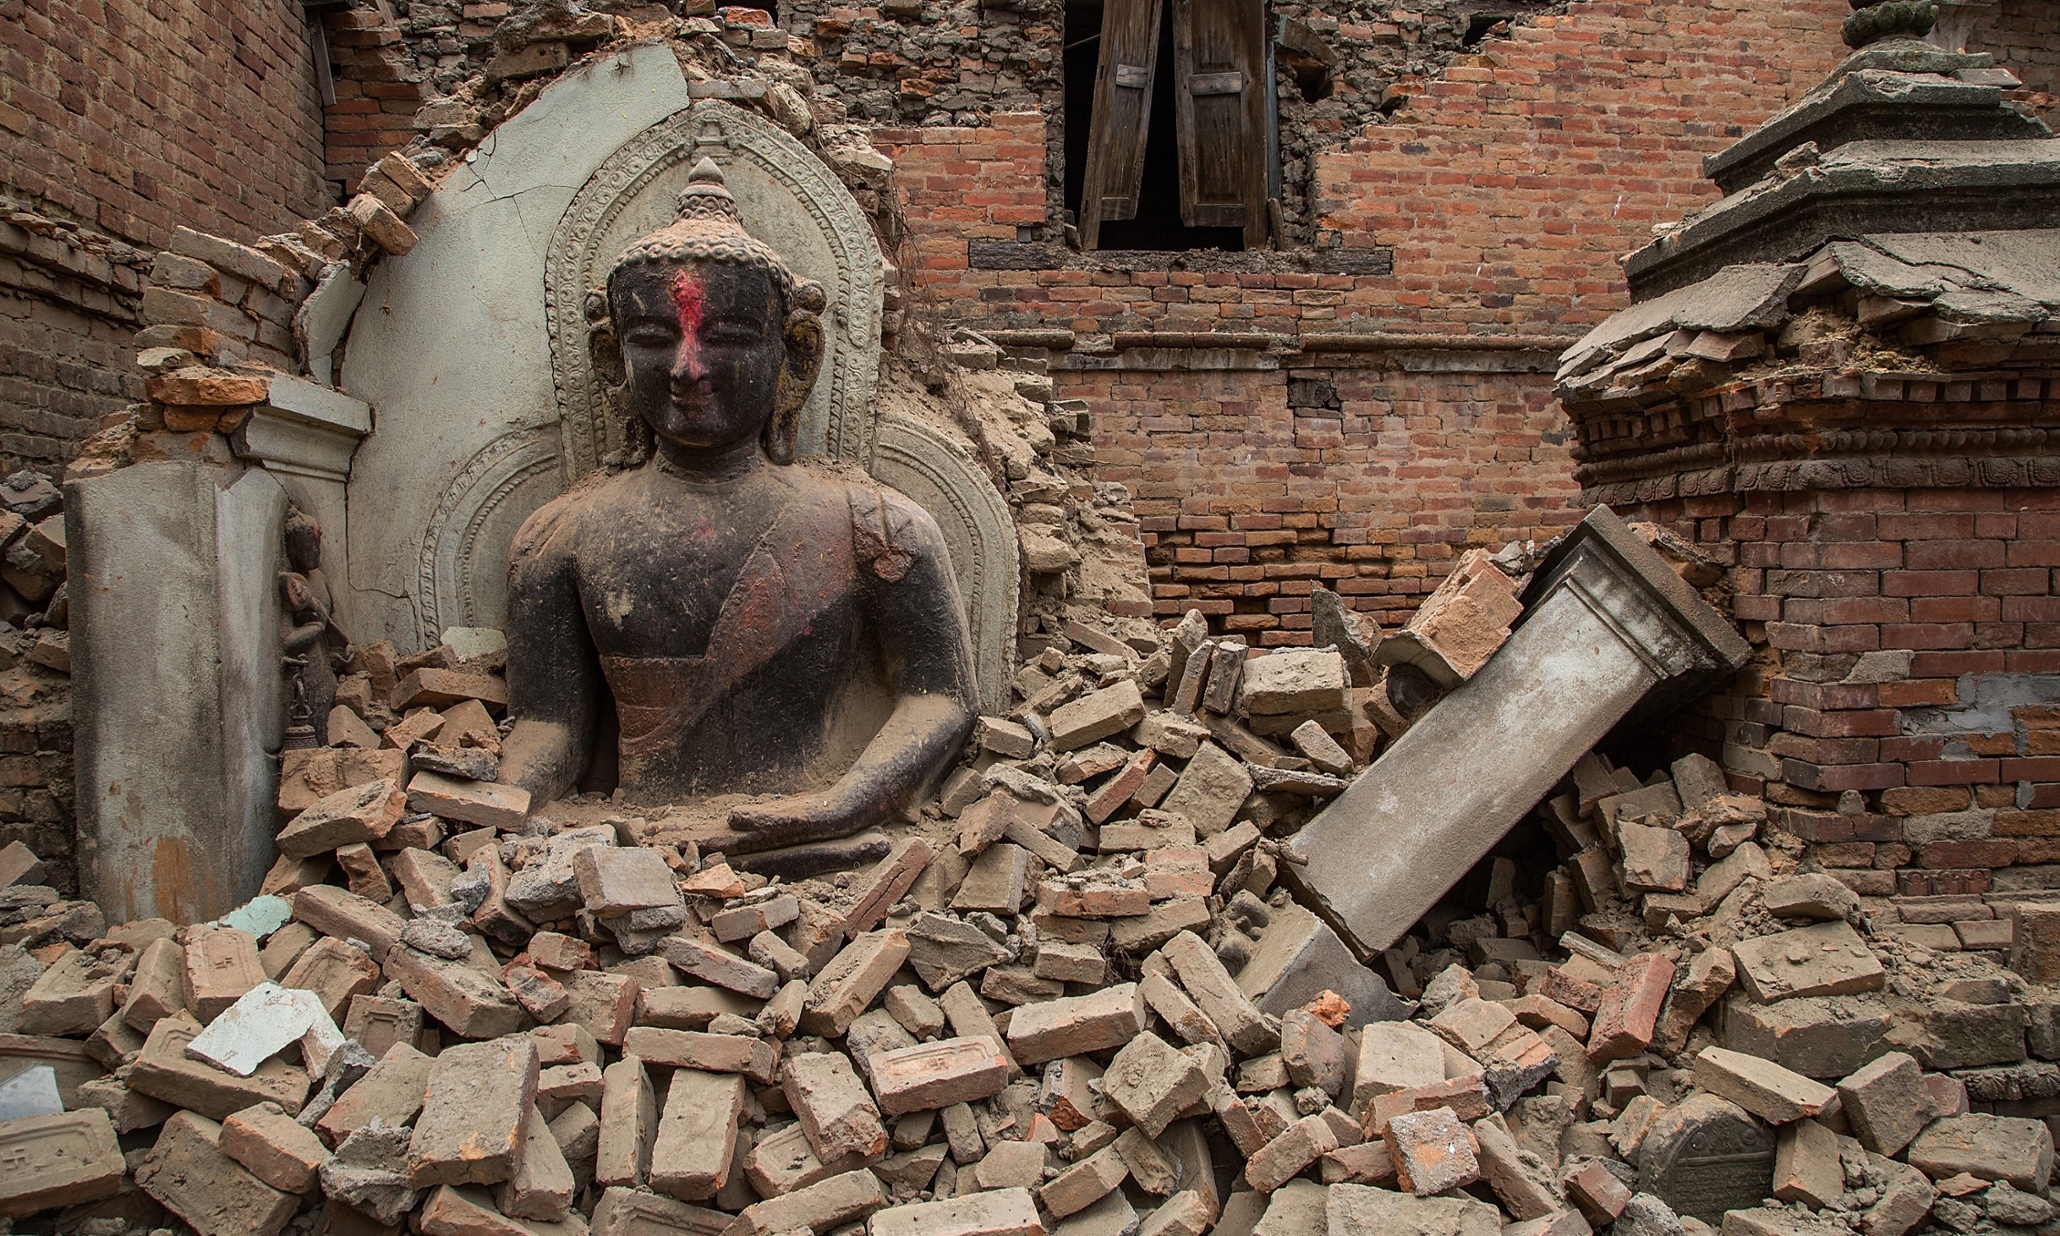


 Japan is a highly seismic area with noticeable quakes in some areas occurring nearly daily. But things began to escalate for the Kyushu region on Thursday night when a magnitude 6.5 quake brought several buildings down. As rescue efforts began the region had two more huge after shocks during the night, one over Mg 6 and the other > Mg 5. By midday Friday the death toll stood at 9 with over 800 injured and although the aftershocks kept coming many >Mg 4 people were still being pulled from the rubble. Sadly these events were quite possibly a precursor to something larger.
 So far 22 more people have been reported dead but this is expected to rise in the coming days with at least 80 people known to betrapped in rubble. 11 of which are trapped in a Tokai university apartment in the town of Minami Aso.


